cells_footnotes() is used to target all footnotes in the
footer section of the table. This is useful for adding custom styles to the
footnotes with tab_style() (using the locations argument). The
'footnotes' location is generated by one or more uses of the tab_footnote()
function. This location helper function cannot be used for the locations
argument of tab_footnote() and doing so will result in a warning (with no
change made to the table).
Examples
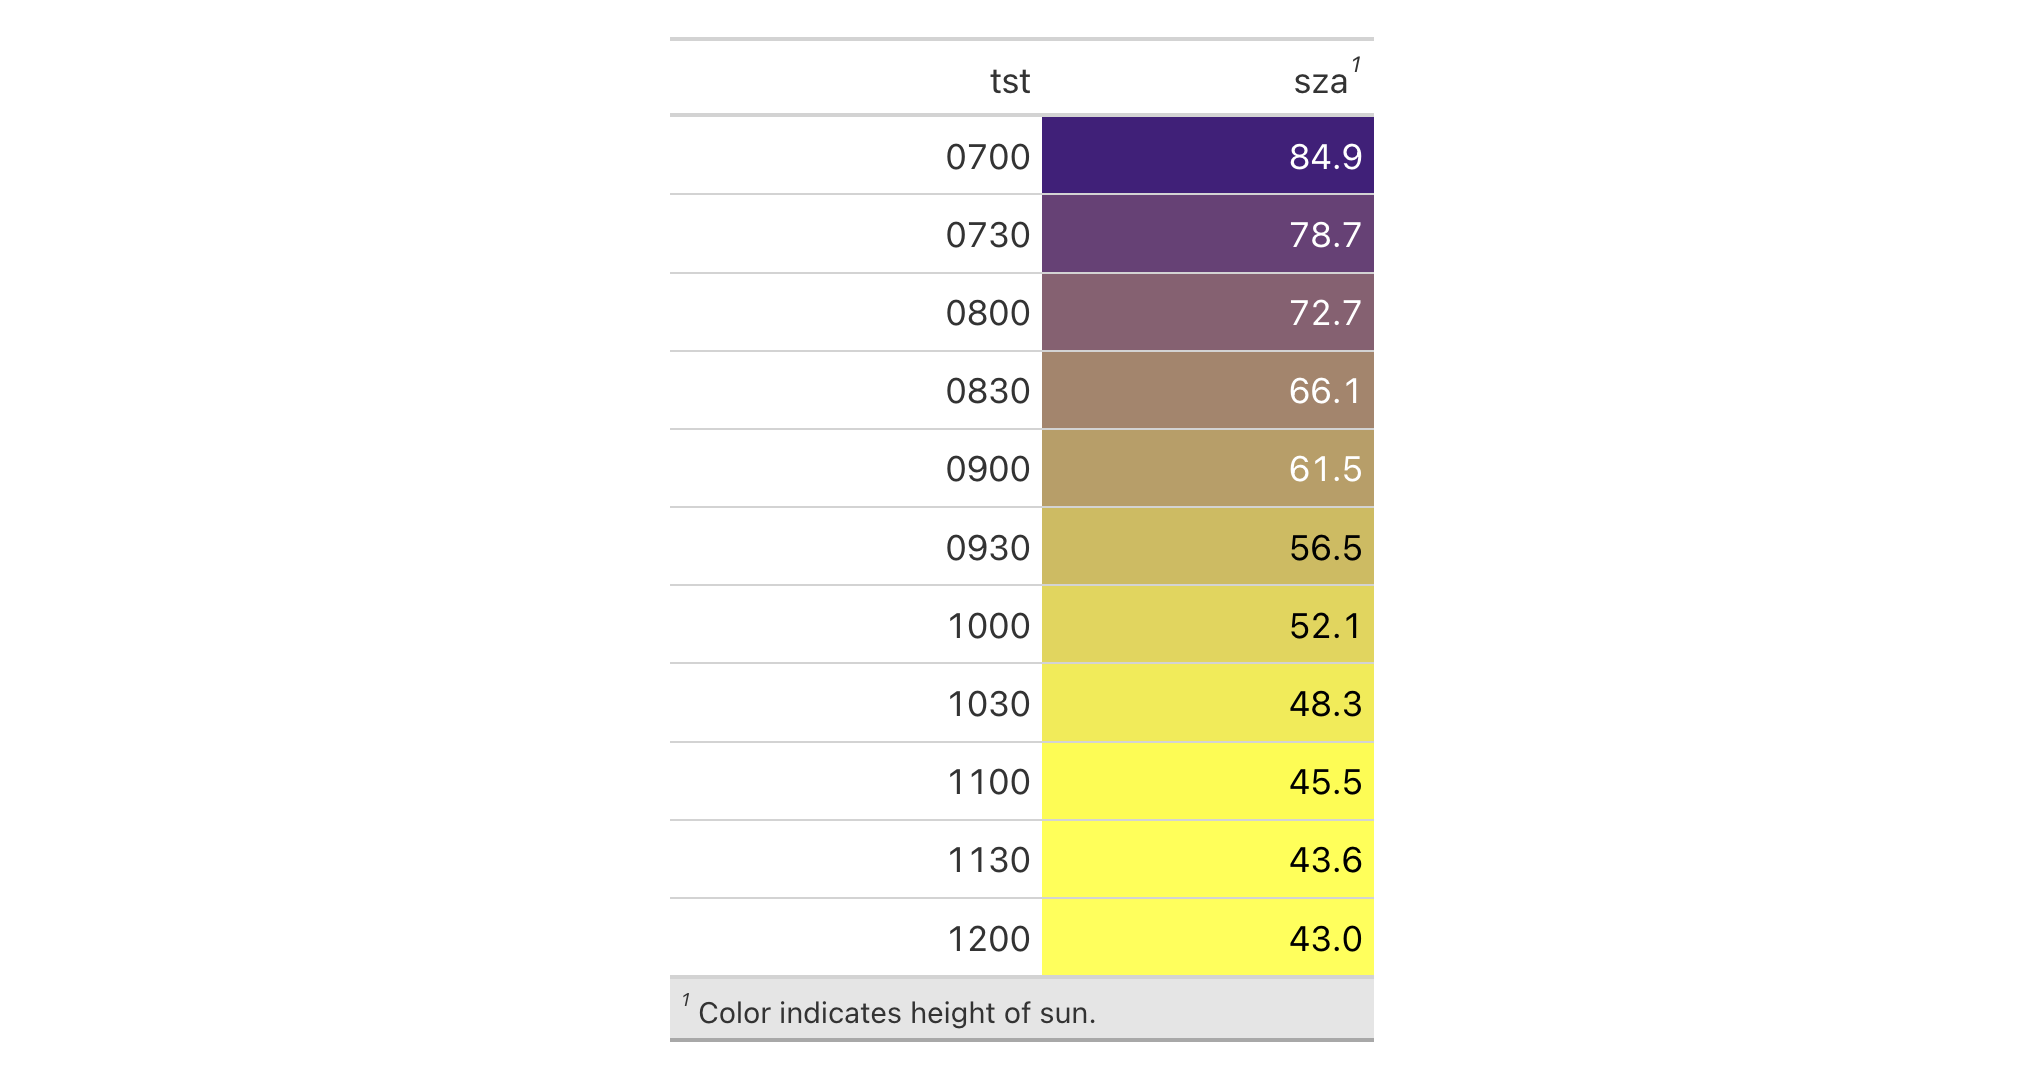
Using a subset of the sza dataset, let's create a gt table. We'd like
to color the sza column so that's done with the data_color() function. We
can add a footnote through the tab_footnote() function and we can also
style the footnotes section. The styling is done through the use of the
tab_style() function and to target the footnotes we use locations = cells_footnotes().
sza |>
  dplyr::filter(
    latitude == 20 &
      month == "jan" &
      !is.na(sza)
  ) |>
  dplyr::select(-latitude, -month) |>
  gt() |>
  data_color(
    columns = sza,
    palette = c("white", "yellow", "navyblue"),
    domain = c(0, 90)
  ) |>
  tab_footnote(
    footnote = "Color indicates height of sun.",
    locations = cells_column_labels(columns = sza)
  ) |>
  tab_options(table.width = px(320)) |>
  tab_style(
    style = list(
      cell_text(size = "smaller"),
      cell_fill(color = "gray90")
      ),
    locations = cells_footnotes()
  )
See also
Other location helper functions:
cells_body(),
cells_column_labels(),
cells_column_spanners(),
cells_grand_summary(),
cells_row_groups(),
cells_source_notes(),
cells_stub(),
cells_stub_grand_summary(),
cells_stub_summary(),
cells_stubhead(),
cells_summary(),
cells_title(),
location-helper