Add grand summary rows by using the table data and any suitable aggregation
functions. With grand summary rows, all of the available data in the gt
table is incorporated (regardless of whether some of the data are part of row
groups). Multiple grand summary rows can be added via expressions given to
fns. You can selectively format the values in the resulting grand summary
cells by use of formatting expressions in fmt.
Usage
grand_summary_rows(
  data,
  columns = everything(),
  fns = NULL,
  fmt = NULL,
  side = c("bottom", "top"),
  missing_text = "---",
  formatter = NULL,
  ...
)
Arguments
- data
The gt table data object
obj:<gt_tbl>// requiredThis is the gt table object that is commonly created through use of the
gt()function.- columns
Columns to target
<column-targeting expression>// default:everything()The columns for which the summaries should be calculated. Can either be a series of column names provided in
c(), a vector of column indices, or a select helper function (e.g.starts_with(),ends_with(),contains(),matches(),num_range(), andeverything()).- fns
Aggregation Expressions
<expression|list of expressions>Functions used for aggregations. This can include base functions like
mean,min,max,median,sd, orsumor any other user-defined aggregation function. Multiple functions, each of which would generate a different row, are to be supplied within alist(). We can specify the functions by use of function names in quotes (e.g.,"sum"), as bare functions (e.g.,sum), or in formula form (e.g.,minimum ~ min(.)) where the LHS could be used to supply the summary row label and ID values. More information on this can be found in the Aggregation expressions forfnssection.- fmt
Formatting expressions
<expression|list of expressions>Formatting expressions in formula form. The RHS of
~should contain a formatting call (e.g.,~ fmt_number(., decimals = 3, use_seps = FALSE). Optionally, the LHS could contain a group-targeting expression (e.g.,"group_a" ~ fmt_number(.)). More information on this can be found in the Formatting expressions forfmtsection.- side
Side used for placement of grand summary rows
singl-kw:[bottom|top]// default:"bottom"Should the grand summary rows be placed at the
"bottom"(the default) or the"top"of the table?- missing_text
Replacement text for
NAvaluesscalar<character>// default:"---"The text to be used in place of
NAvalues in summary cells with no data outputs.- formatter
Deprecated Formatting function
<expression>Deprecated, please use
fmtinstead. This was previously used as a way to input a formatting function name, which could be any of thefmt_*()functions available in the package (e.g.,fmt_number(),fmt_percent(), etc.), or a custom function usingfmt(). The options of a formatter can be accessed through....- ...
Deprecated Formatting arguments
<Named arguments>Deprecated (along with
formatter) but otherwise used for argument values for a formatting function supplied informatter. For example, if usingformatter = fmt_number, options such asdecimals = 1,use_seps = FALSE, and the like can be used here.
Using columns to target column data for aggregation
Targeting of column data for which aggregates should be generated is done
through the columns argument. We can declare column names in c() (with
bare column names or names in quotes) or we can use
tidyselect-style expressions. This can be as basic as supplying a select
helper like starts_with(), or, providing a more complex incantation like
where(~ is.numeric(.x) & max(.x, na.rm = TRUE) > 1E6)
which targets numeric columns that have a maximum value greater than
1,000,000 (excluding any NAs from consideration).
By default all columns are selected (with the everything() default). This
default may be not what's needed unless all columns can undergo useful
aggregation by expressions supplied in fns.
Aggregation expressions for fns
There are a number of ways to express how an aggregation should work for
each summary row. In addition to that, we have the ability to pass important
information such as the summary row ID value and its label (the former
necessary for targeting within tab_style() or tab_footnote() and the
latter used for display in the rendered table). Here are a number of
instructive examples for how to supply such expressions.
Double-sided formula with everything supplied
We can be explicit and provide a double-sided formula (in the form
<LHS> ~ <RHS>) that expresses everything about a summary row. That is, it
has an aggregation expression (where . represents the data in the
focused column). Here's an example:
list(id = "minimum", label = "min") ~ min(., na.rm = TRUE)
The left side (the list) contains named elements that identify the id and
label for the summary row. The right side has an expression for obtaining
a minimum value (dropping NA values in the calculation).
The list() can be replaced with c() but the advantage of a list is
allowing the use of the md() and html() helper functions. The above
example can be written as:
list(id = "minimum", label = md("**Minimum**")) ~ min(., na.rm = TRUE)
and we can have that label value interpreted as Markdown text.
Function names in quotes
With fns = "min" we get the equivalent of the fuller expression:
list(id = "min", label = "min") ~ min(., na.rm = TRUE)
For sake of convenience, common aggregation functions with the na.rm
argument will be rewritten with the na.rm = TRUE option. These functions
are: "min", "max", "mean", "median", "sd", and "sum".
Should you need to specify multiple aggregation functions in this way (giving
you multiple summary rows), use c() or list().
RHS formula expressions
With fns = ~ min(.) or fns = list(~ min(.)), gt will use the function
name as the id and label. The expansion of this shorthand to full form
looks like this:
list(id = "min", label = "min") ~ min(.)
The RHS expression is kept as written and the name portion is both the id
and the label.
Named vector or list with RHS formula expression
Using fns = c(minimum = ~ min(.)) or fns = list(minimum = ~ min(.))
expands to this:
list(id = "minimum", label = "minimum") ~ min(.)
Unnamed vector or list with RHS formula expression
With fns = c("minimum", "min") ~ min(.) or
fns = list("minimum", "min") ~ min(.) the LHS contains the label and id
values and, importantly, the order is label first and id second. This can
be rewritten as:
list(id = "min", label = "minimum") ~ min(.)
If the vector or list is partially named, gt has enough to go on to
disambiguate the unnamed element. So with
fns = c("minimum", label = "min") ~ min(.), "min" is indeed the label
and "minimum" is taken as the id value.
A fully named list with three specific elements
We can avoid using a formula if we are satisfied with the default options of
a function (except some of those functions with the na.rm options, see
above). Instead, a list with the named elements id, label, and fn could
be used. It can look like this:
fns = list(id = "mean_id", label = "average", fn = "mean")
which translates to
list(id = "mean_id", label = "average") ~ mean(., na.rm = TRUE)
Formatting expressions for fmt
Given that we are generating new data in a table, we might also want to
take the opportunity to format those new values right away. We can do this
in the fmt argument, either with a single expression or a number of them
in a list.
We can supply a one-sided (RHS only) expression to fmt, and, several can
be provided in a list. The expression uses a formatting function (e.g.,
fmt_number(), fmt_currency(), etc.) and it must contain an initial .
that stands for the data object. If performing numeric formatting on all
columns in the new grand summary rows, it might look something like this:
fmt = ~ fmt_number(., decimals = 1, use_seps = FALSE)
We can use the columns and rows arguments that are available in every
formatting function. This allows us to format only a subset of columns or
rows. Summary rows can be targeted by using their ID values and these are
settable within expressions given to fns (see the Aggregation expressions
for fns section for details on this). Here's an example with hypothetical
column and row names:
fmt = ~ fmt_number(., columns = num, rows = "mean", decimals = 3)
Extraction of summary rows
Should we need to obtain the summary data for external purposes,
extract_summary() can be used with a gt_tbl object where summary rows
were added via grand_summary_rows() or summary_rows().
Examples
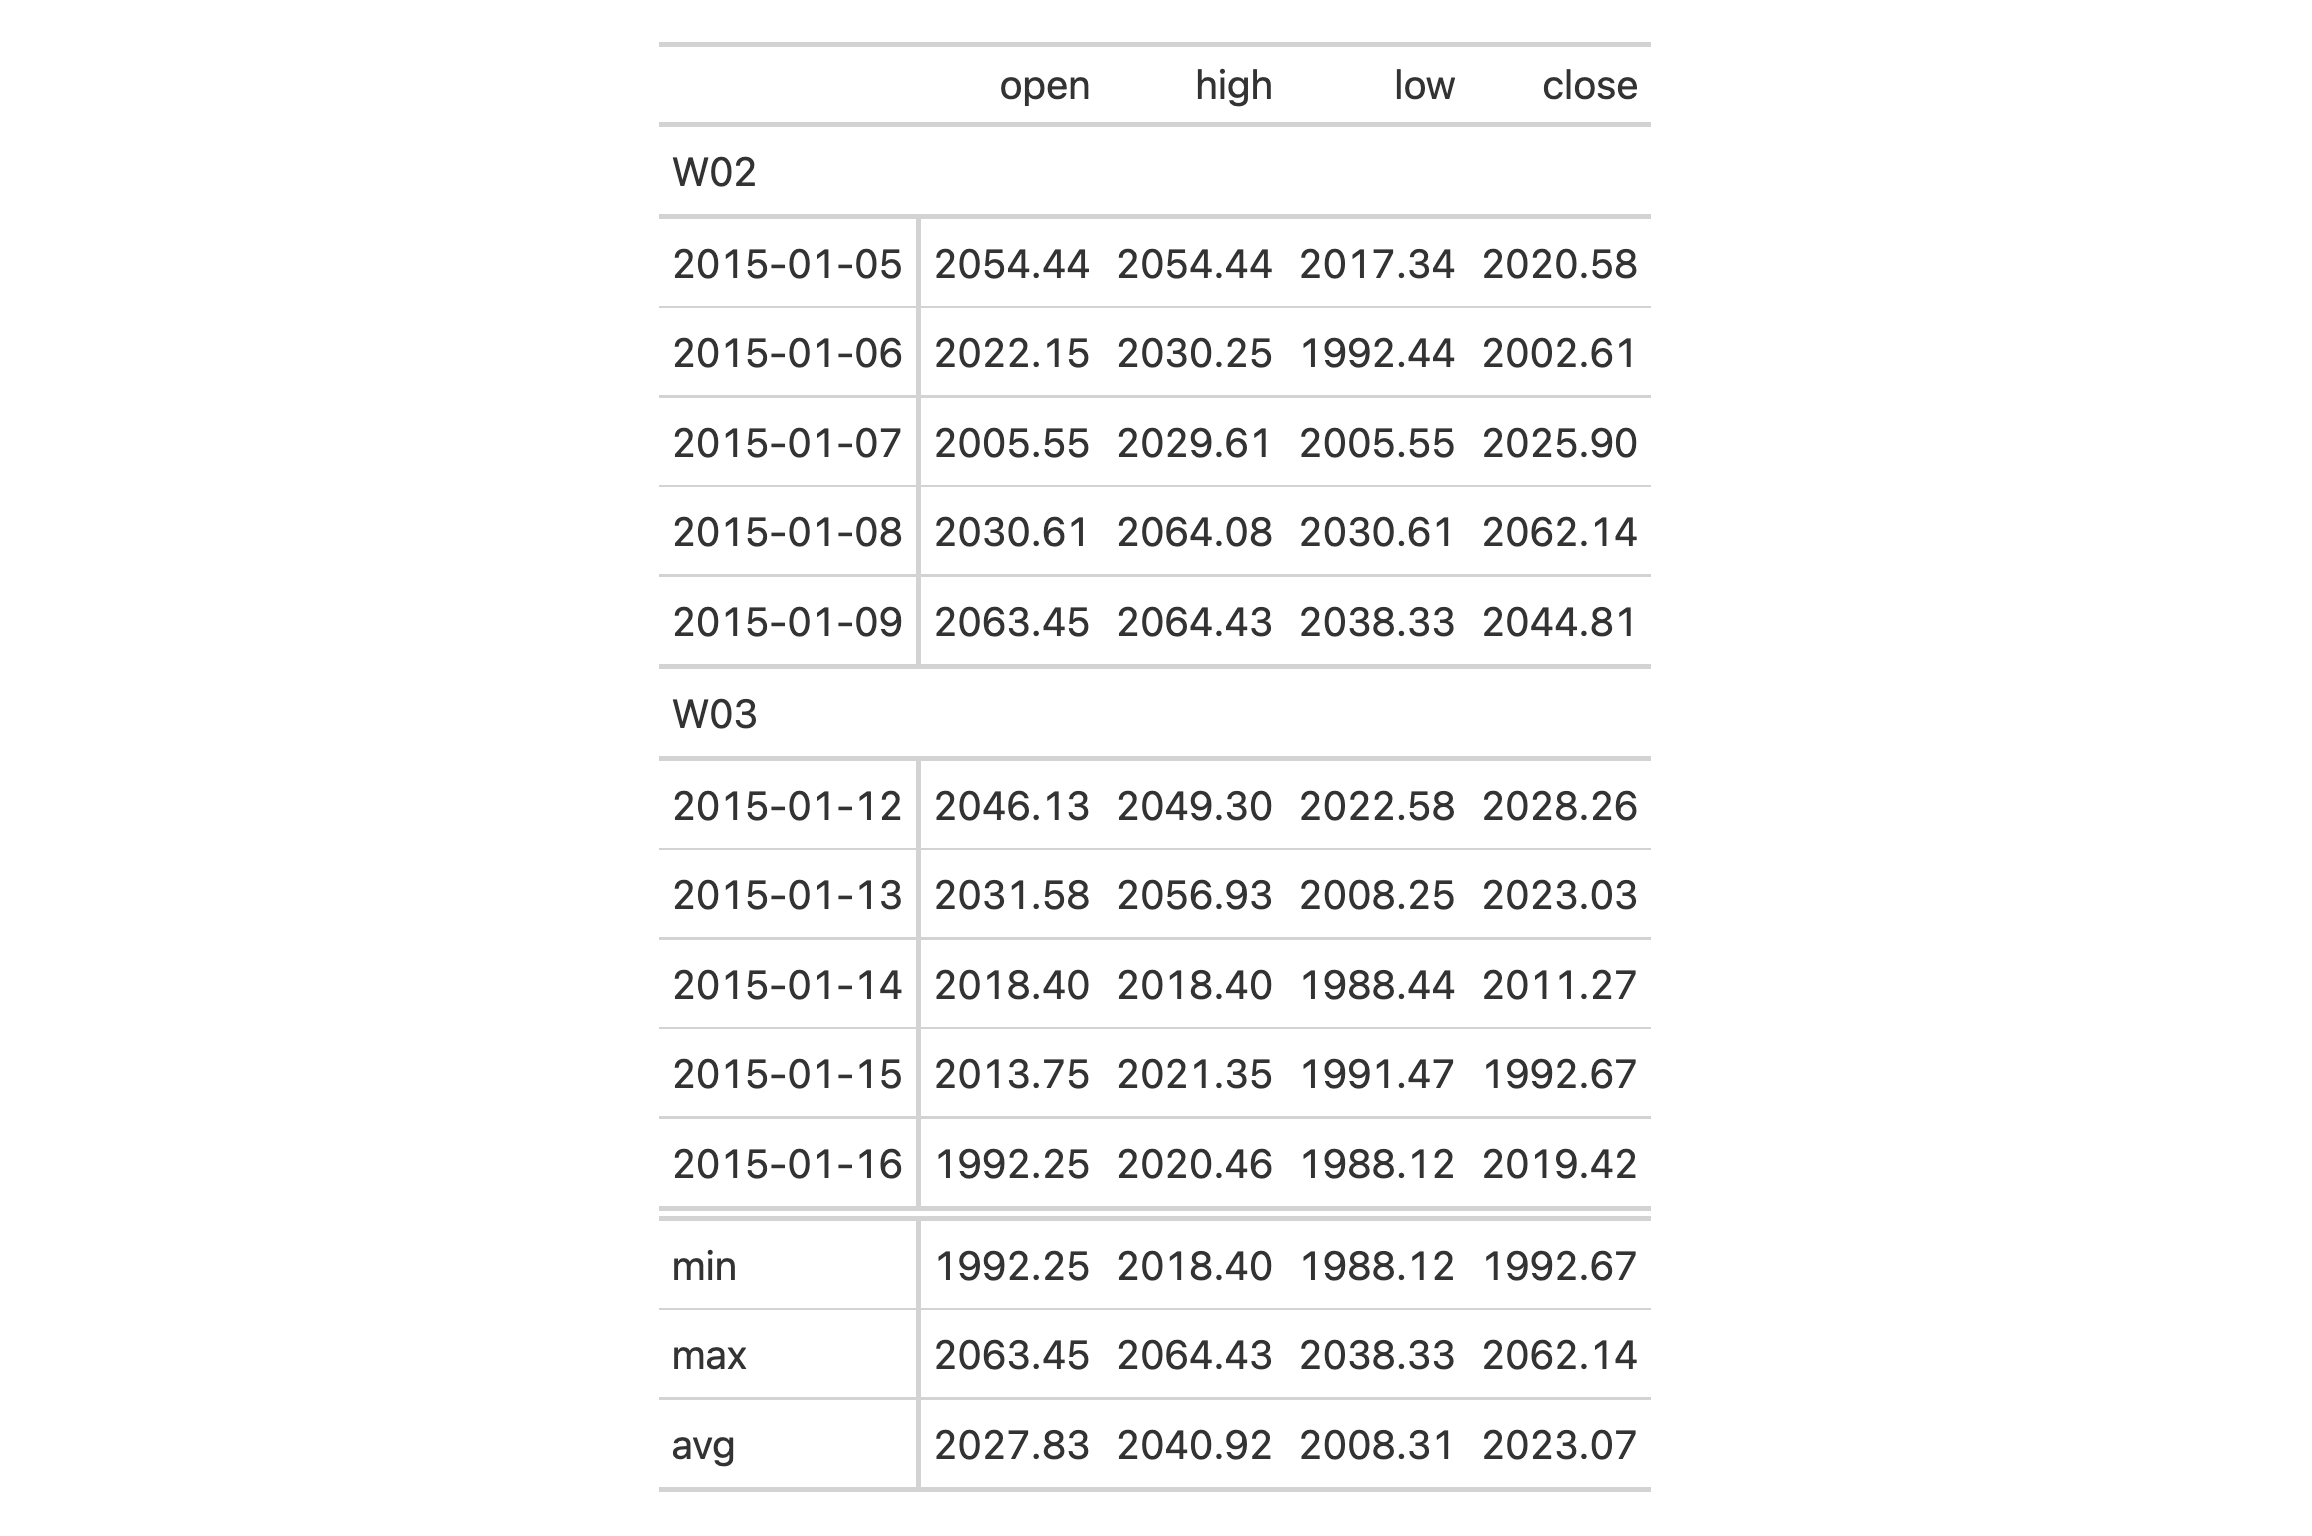
Use a modified version of the sp500 dataset to create a gt table with
row groups and row labels. Create the grand summary rows min, max, and
avg for the table with grand_summary_rows().
sp500 |>
  dplyr::filter(date >= "2015-01-05" & date <= "2015-01-16") |>
  dplyr::arrange(date) |>
  dplyr::mutate(week = paste0("W", strftime(date, format = "%V"))) |>
  dplyr::select(-adj_close, -volume) |>
  gt(
    rowname_col = "date",
    groupname_col = "week"
  ) |>
  grand_summary_rows(
    columns = c(open, high, low, close),
    fns = list(
      min ~ min(.),
      max ~ max(.),
      avg ~ mean(.)
    ),
    fmt = ~ fmt_number(., use_seps = FALSE)
  )
Let's take the countrypops dataset and process that a bit before handing
it off to gt. We can create a single grand summary row with totals that
appears at the top of the table body (with side = "top"). We can define the
aggregation with a list that contains parameters for the grand summary row
label ("TOTALS"), the ID value of that row ("totals"), and the
aggregation function (expressed as "sum", which gt recognizes as the
sum() function). Finally, we'll add a background fill to the grand summary
row with tab_style().
countrypops |>
  dplyr::filter(country_code_2 %in% c("BE", "NL", "LU")) |>
  dplyr::filter(year %% 10 == 0) |>
  dplyr::select(country_name, year, population) |>
  tidyr::pivot_wider(names_from = year, values_from = population) |>
  gt(rowname_col = "country_name") |>
  tab_header(title = "Populations of the Benelux Countries") |>
  tab_spanner(columns = everything(), label = "Year") |>
  fmt_integer() |>
  grand_summary_rows(
    fns =  list(label = "TOTALS", id = "totals", fn = "sum"),
    fmt = ~ fmt_integer(.),
    side = "top"
  ) |>
  tab_style(
    locations = cells_grand_summary(),
    style = cell_fill(color = "lightblue" |> adjust_luminance(steps = +1))
  )
See also
Other row addition/modification functions:
row_group_order(),
row_order(),
rows_add(),
rows_hide(),
rows_unhide(),
summary_columns(),
summary_rows()