With tab_style() we can target specific cells
and apply styles to them. This is best done in conjunction with the helper
functions cell_text(), cell_fill(), and cell_borders(). Currently, this
function is focused on the application of styles for HTML output only (as
such, other output formats will ignore all tab_style() calls). Using the
aforementioned helper functions, here are some of the styles we can apply:
the background color of the cell (
cell_fill():color)the cell's text color, font, and size (
cell_text():color,font,size)the text style (
cell_text():style), enabling the use of italics or oblique text.the text weight (
cell_text():weight), allowing the use of thin to bold text (the degree of choice is greater with variable fonts)the alignment and indentation of text (
cell_text():alignandindent)the cell borders (
cell_borders())
Arguments
- data
The gt table data object
obj:<gt_tbl>// requiredThis is the gt table object that is commonly created through use of the
gt()function.- style
Style declarations
<style expressions>// requiredThe styles to use for the cells at the targeted
locations. Thecell_text(),cell_fill(), andcell_borders()helper functions can be used here to more easily generate valid styles. If using more than one helper function to define styles, all calls must be enclosed in alist(). Custom CSS declarations can be used for HTML output by including acss()-based statement as a list item.- locations
Locations to target
<locations expressions>// requiredThe cell or set of cells to be associated with the style. Supplying any of the
cells_*()helper functions is a useful way to target the location cells that are associated with the styling. These helper functions are:cells_title(),cells_stubhead(),cells_column_spanners(),cells_column_labels(),cells_row_groups(),cells_stub(),cells_body(),cells_summary(),cells_grand_summary(),cells_stub_summary(),cells_stub_grand_summary(),cells_footnotes(), andcells_source_notes(). Additionally, we can enclose severalcells_*()calls within alist()if we wish to apply styling to different types of locations (e.g., body cells, row group labels, the table title, etc.).
Using from_column() with cell_*() styling functions
from_column() can be used with certain arguments of cell_fill() and
cell_text(); this allows you to get parameter values from a specified
column within the table. This means that body cells targeted for styling
could be formatted a little bit differently, using options taken from a
column. For cell_fill(), we can use from_column() for its color
argument. cell_text() allows the use of from_column() in the following arguments:
colorsizealignv_alignstyleweightstretchdecoratetransformwhitespaceindent
Please note that for all of the aforementioned arguments, a from_column()
call needs to reference a column that has data of the correct type (this is
different for each argument). Additional columns for parameter values can be
generated with cols_add() (if not already present). Columns that contain
parameter data can also be hidden from final display with cols_hide().
Importantly, a tab_style() call with any use of from_column() within
styling expressions must only use cells_body() within locations. This is
because we cannot map multiple options taken from a column onto other
locations.
Examples
Let's use the exibble dataset to create a simple, two-column gt table
(keeping only the num and currency columns). With tab_style()
(called twice), we'll selectively add style to the values formatted by
fmt_number(). In the style argument of each tab_style() call, we can
define multiple types of styling with cell_fill() and cell_text()
(enclosed in a list). The cells to be targeted for styling require the use of
helpers like cells_body(), which is used here with different columns and
rows being targeted.
exibble |>
  dplyr::select(num, currency) |>
  gt() |>
  fmt_number(decimals = 1) |>
  tab_style(
    style = list(
      cell_fill(color = "lightcyan"),
      cell_text(weight = "bold")
      ),
    locations = cells_body(
      columns = num,
      rows = num >= 5000
    )
  ) |>
  tab_style(
    style = list(
      cell_fill(color = "#F9E3D6"),
      cell_text(style = "italic")
      ),
    locations = cells_body(
      columns = currency,
      rows = currency < 100
    )
  )
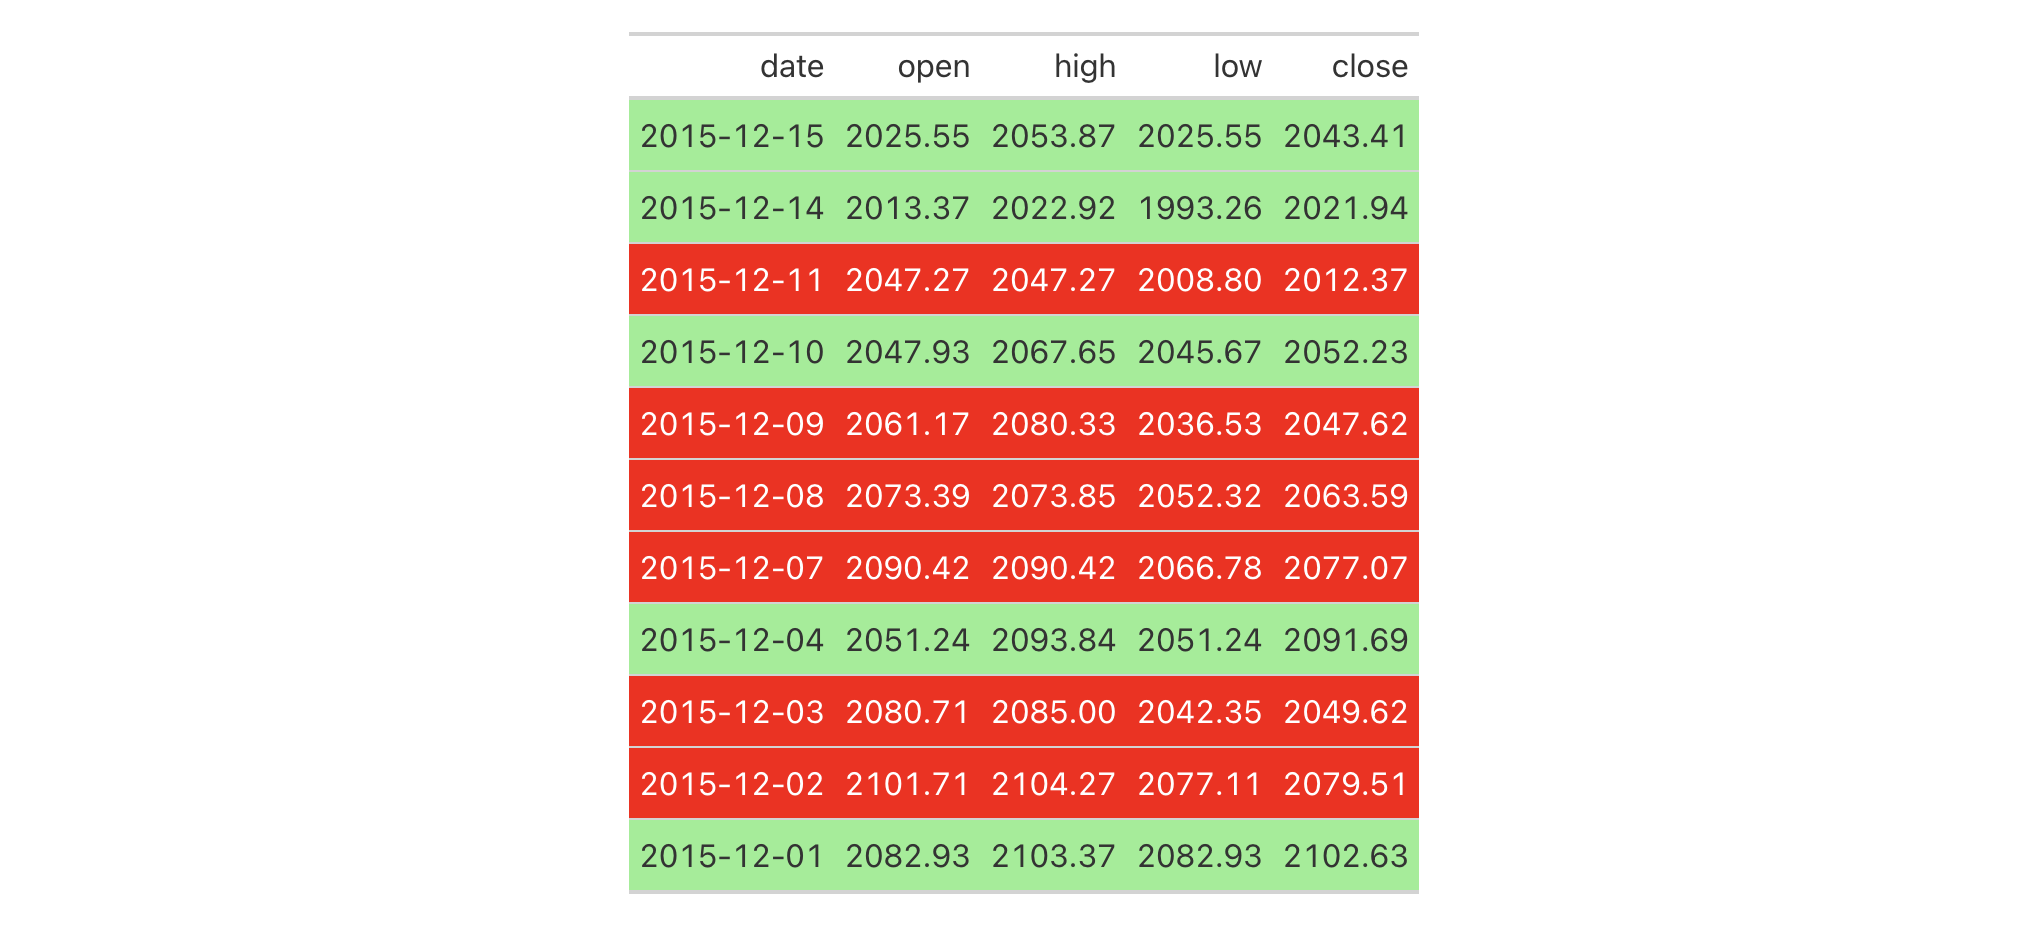
With a subset of the sp500 dataset, we'll create a different gt
table. Here, we'll color the background of entire rows of body cells and do
so on the basis of value expressions involving the open and close
columns.
sp500 |>
  dplyr::filter(
    date >= "2015-12-01" &
    date <= "2015-12-15"
  ) |>
  dplyr::select(-c(adj_close, volume)) |>
  gt() |>
  tab_style(
    style = cell_fill(color = "lightgreen"),
    locations = cells_body(rows = close > open)
  ) |>
  tab_style(
    style = list(
      cell_fill(color = "red"),
      cell_text(color = "white")
      ),
    locations = cells_body(rows = open > close)
  )
With another two-column table based on the exibble dataset, let's create
a gt table. First, we'll replace missing values with sub_missing().
Next, we'll add styling to the char column. This styling will be
HTML-specific and it will involve (all within a list): (1) a cell_fill()
call (to set a "lightcyan" background), and (2) a string containing a CSS
style declaration ("font-variant: small-caps;").
exibble |>
  dplyr::select(char, fctr) |>
  gt() |>
  sub_missing() |>
  tab_style(
    style = list(
      cell_fill(color = "lightcyan"),
      "font-variant: small-caps;"
    ),
    locations = cells_body(columns = char)
  )
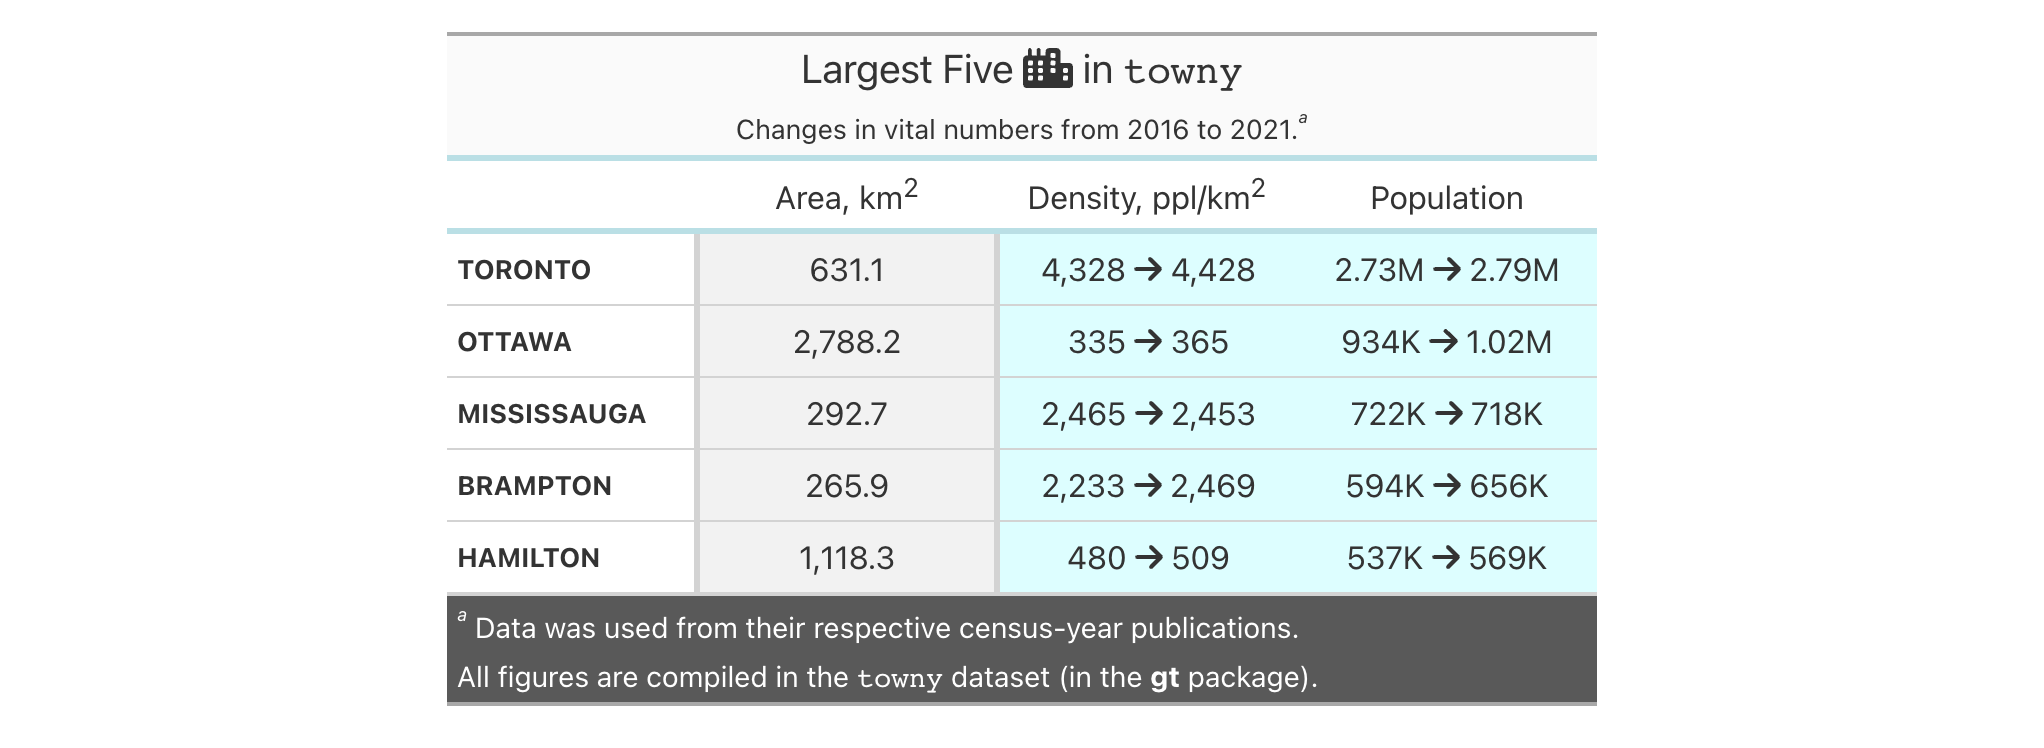
In the following table based on the towny dataset, we'll use a larger
number of tab_style() calls with the aim of styling each location available
in the table. Over six separate uses of tab_style(), different body cells
are styled with background colors, the header and the footer also receive
background color fills, borders are applied to a column of body cells and
also to the column labels, and, the row labels in the stub receive a custom
text treatment.
towny |>
  dplyr::filter(csd_type == "city") |>
  dplyr::select(
    name, land_area_km2, density_2016, density_2021,
    population_2016, population_2021
  ) |>
  dplyr::slice_max(population_2021, n = 5) |>
  gt(rowname_col = "name") |>
  tab_header(
    title = md(paste("Largest Five", fontawesome::fa("city") , "in `towny`")),
    subtitle = "Changes in vital numbers from 2016 to 2021."
  ) |>
  fmt_number(
    columns = starts_with("population"),
    n_sigfig = 3,
    suffixing = TRUE
  ) |>
  fmt_integer(columns = starts_with("density")) |>
  fmt_number(columns = land_area_km2, decimals = 1) |>
  cols_merge(
    columns = starts_with("density"),
    pattern = paste("{1}", fontawesome::fa("arrow-right"), "{2}")
  ) |>
  cols_merge(
    columns = starts_with("population"),
    pattern = paste("{1}", fontawesome::fa("arrow-right"), "{2}")
  ) |>
  cols_label(
    land_area_km2 = md("Area, km^2^"),
    starts_with("density") ~ md("Density, ppl/km^2^"),
    starts_with("population") ~ "Population"
  ) |>
  cols_align(align = "center", columns = -name) |>
  cols_width(
    stub() ~ px(125),
    everything() ~ px(150)
  ) |>
  tab_footnote(
    footnote = "Data was used from their respective census-year publications.",
    locations = cells_title(groups = "subtitle")
  ) |>
  tab_source_note(source_note = md(
    "All figures are compiled in the `towny` dataset (in the **gt** package)."
  )) |>
  opt_footnote_marks(marks = "letters") |>
  tab_style(
    style = list(
      cell_fill(color = "gray95"),
      cell_borders(sides = c("l", "r"), color = "gray50", weight = px(3))
    ),
    locations = cells_body(columns = land_area_km2)
  ) |>
  tab_style(
    style = cell_fill(color = "lightblue" |> adjust_luminance(steps = 2)),
    locations = cells_body(columns = -land_area_km2)
  ) |>
  tab_style(
    style = list(cell_fill(color = "gray35"), cell_text(color = "white")),
    locations = list(cells_footnotes(), cells_source_notes())
  ) |>
  tab_style(
    style = cell_fill(color = "gray98"),
    locations = cells_title()
  ) |>
  tab_style(
    style = cell_text(
      size = "smaller",
      weight = "bold",
      transform = "uppercase"
    ),
    locations = cells_stub()
  ) |>
  tab_style(
    style = cell_borders(
      sides = c("t", "b"),
      color = "powderblue",
      weight = px(3)
    ),
    locations = list(cells_column_labels(), cells_stubhead())
  )
from_column() can be used to get values from a column. We'll use it in the
next example, which begins with a table having a color name column and a
column with the associated hexadecimal color code. To show the color in a
separate column, we first create one with cols_add() (ensuring that missing
values are replaced with "" via sub_missing()). Then, tab_style() is
used to style that column, using color = from_column()
within cell_fill().
dplyr::tibble(
  name = c(
    "red", "green", "blue", "yellow", "orange",
    "cyan", "purple", "magenta", "lime", "pink"
  ),
  hex = c(
    "#E6194B", "#3CB44B", "#4363D8", "#FFE119", "#F58231",
    "#42D4F4", "#911EB4", "#F032E6", "#BFEF45", "#FABED4"
  )
) |>
  gt(rowname_col = "name") |>
  cols_add(color = rep(NA_character_, 10)) |>
  sub_missing(missing_text = "") |>
  tab_style(
    style = cell_fill(color = from_column(column = "hex")),
    locations = cells_body(columns = color)
  ) |>
  tab_style(
    style = cell_text(font = system_fonts(name = "monospace-code")),
    locations = cells_body()
  ) |>
  opt_all_caps() |>
  cols_width(everything() ~ px(100)) |>
  tab_options(table_body.hlines.style = "none")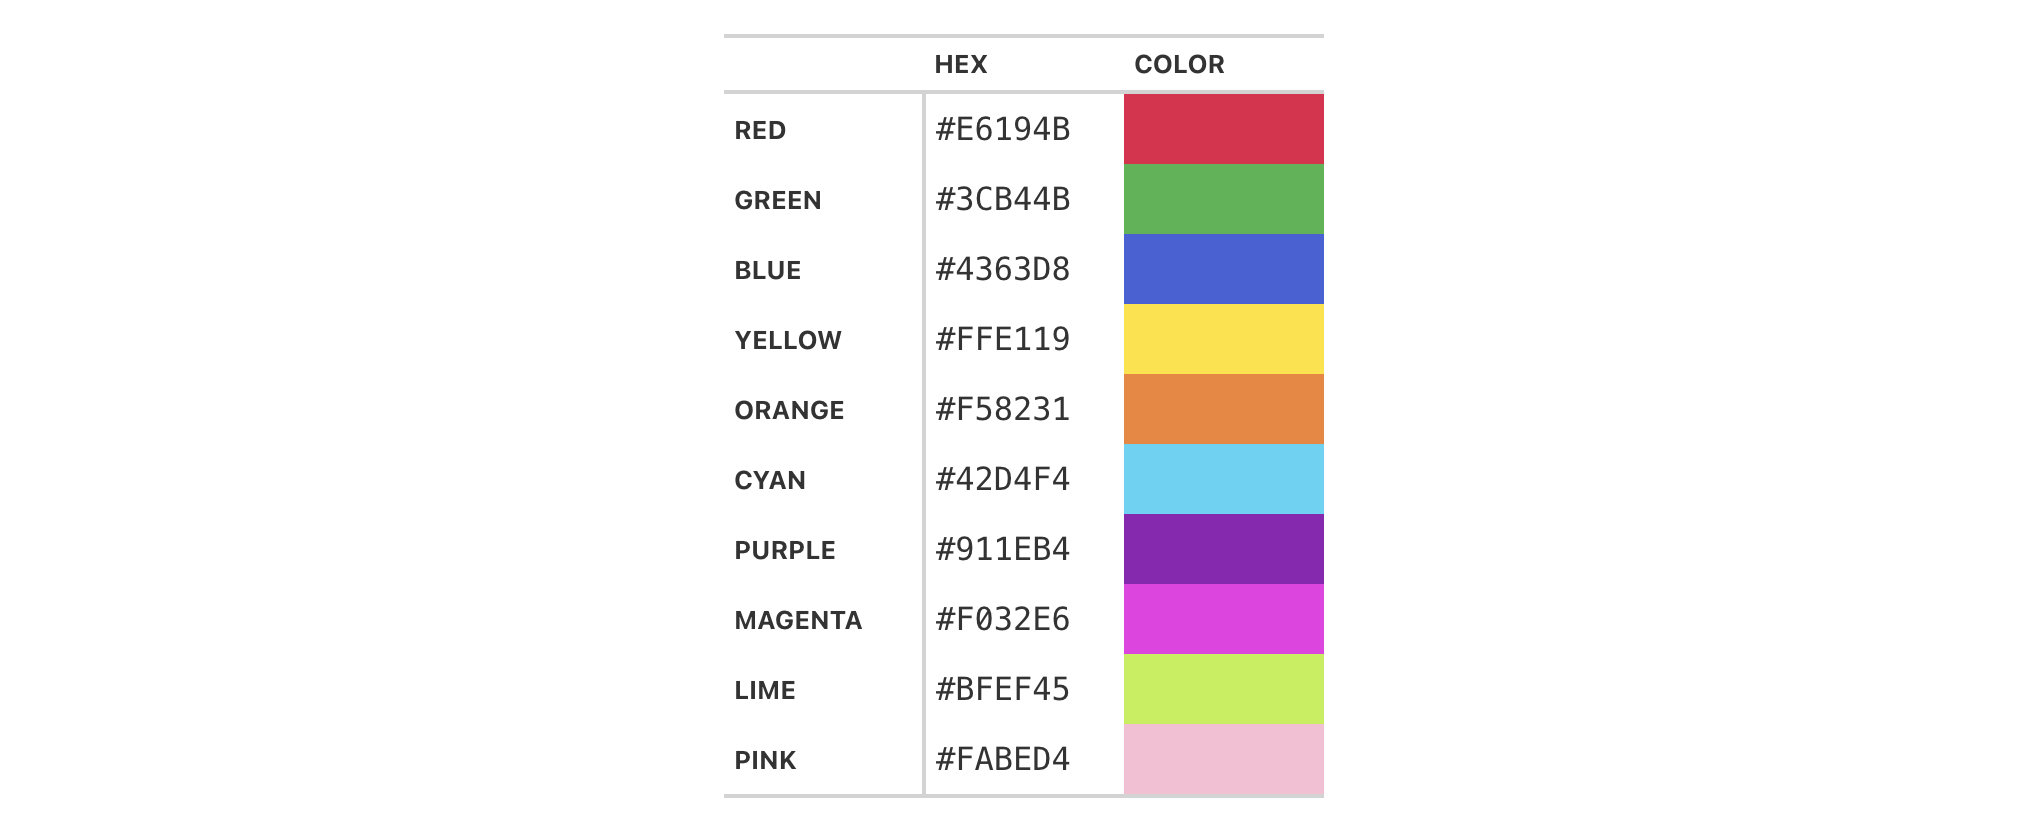
cell_text() also allows the use of from_column() for many of its arguments.
Let's take a small portion of data from sp500 and add an up or down arrow
based on the values in the open and close columns. Within cols_add() we
can create a new column (dir) with an expression to get either "red" or
"green" text from a comparison of the open and close values. These
values are transformed to up or down arrows with text_case_match(), using
fontawesome icons in the end. However, the text values are still present
and can be used by cell_text() within tab_style(). from_column() makes
it possible to use the text in the cells of the dir column as color input
values.
sp500 |>
  dplyr::filter(date > "2015-01-01") |>
  dplyr::slice_min(date, n = 5) |>
  dplyr::select(date, open, close) |>
  gt(rowname_col = "date") |>
  fmt_currency(columns = c(open, close)) |>
  cols_add(dir = ifelse(close < open, "red", "forestgreen")) |>
  cols_label(dir = "") |>
  text_case_match(
    "red" ~ fontawesome::fa("arrow-down"),
    "forestgreen" ~ fontawesome::fa("arrow-up")
  ) |>
  tab_style(
    style = cell_text(color = from_column("dir")),
    locations = cells_body(columns = dir)
  )
See also
cell_text(), cell_fill(), and cell_borders() as helpers for
defining custom styles and cells_body() as one of many useful helper
functions for targeting the locations to be styled.
Other part creation/modification functions:
tab_caption(),
tab_footnote(),
tab_header(),
tab_info(),
tab_options(),
tab_row_group(),
tab_source_note(),
tab_spanner(),
tab_spanner_delim(),
tab_stub_indent(),
tab_stubhead(),
tab_style_body()