Increase or decrease the horizontal padding throughout all locations of a
gt table by use of a scale factor, which here is defined by a real
number between 0 and 3. This function serves as a shortcut for setting
the following eight options in tab_options():
heading.padding.horizontalcolumn_labels.padding.horizontaldata_row.padding.horizontalrow_group.padding.horizontalsummary_row.padding.horizontalgrand_summary_row.padding.horizontalfootnotes.padding.horizontalsource_notes.padding.horizontal
Arguments
- data
The gt table data object
obj:<gt_tbl>// requiredThis is the gt table object that is commonly created through use of the
gt()function.- scale
Scale factor
scalar<numeric|integer>(0>=val>=3)// default:1A scale factor by which the horizontal padding will be adjusted. Must be a number between
0and3.
Examples
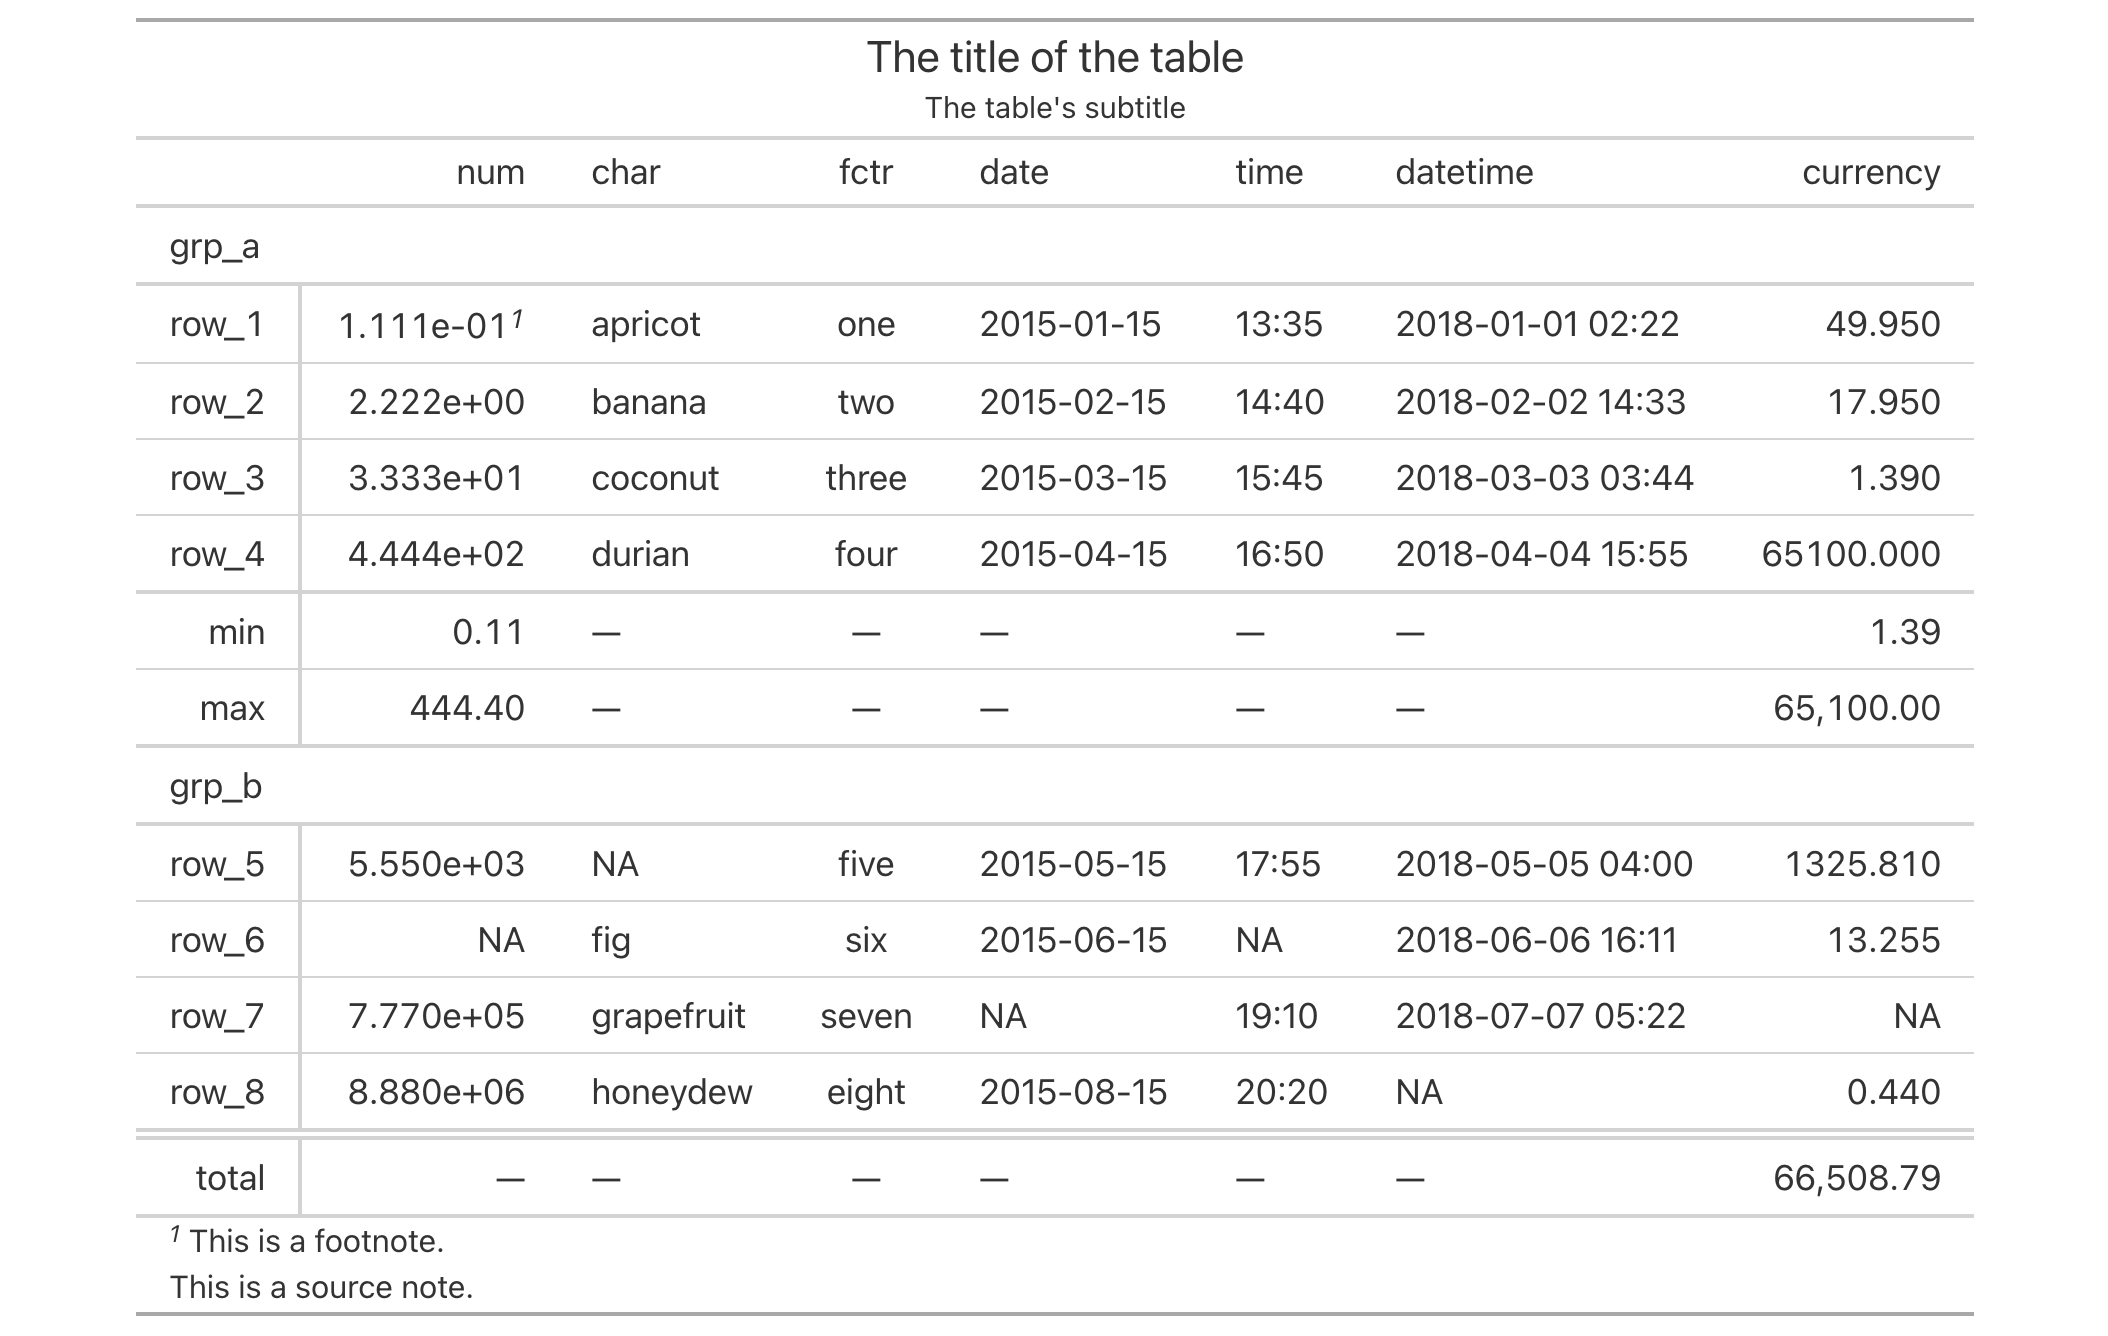
Use the exibble dataset to create a gt table with a number of table
parts added (using functions like summary_rows(), grand_summary_rows(),
and more). Following that, we'll increase the amount of horizontal padding
across the entire table with opt_horizontal_padding(). Using a scale
value of 3 (up from the default of 1) means the horizontal space will
be greatly increased, resulting in a more spacious table.
exibble |>
  gt(rowname_col = "row", groupname_col = "group") |>
  summary_rows(
    groups = "grp_a",
    columns = c(num, currency),
    fns = c("min", "max")
  ) |>
  grand_summary_rows(
    columns = currency,
    fns = total ~ sum(., na.rm = TRUE)
  ) |>
  tab_source_note(source_note = "This is a source note.") |>
  tab_footnote(
    footnote = "This is a footnote.",
    locations = cells_body(columns = 1, rows = 1)
  ) |>
  tab_header(
    title = "The title of the table",
    subtitle = "The table's subtitle"
  ) |>
  opt_horizontal_padding(scale = 3)