opt_table_lines() sets table lines in one of three possible ways:
(1) all possible table lines drawn ("all"), (2) no table lines at all
("none"), and (3) resetting to the default line styles ("default"). This
is great if you want to start off with lots of lines and subtract just a few
of them with tab_options() or tab_style(). Or, use it to start with a
completely lineless table, adding individual lines as needed.
Usage
opt_table_lines(data, extent = c("all", "none", "default"))Arguments
- data
The gt table data object
obj:<gt_tbl>// requiredThis is the gt table object that is commonly created through use of the
gt()function.- extent
Extent of lines added
singl-kw:[all|none|default]// default:"all"The extent to which lines will be visible in the table. Options are
"all","none", or"default".
Examples
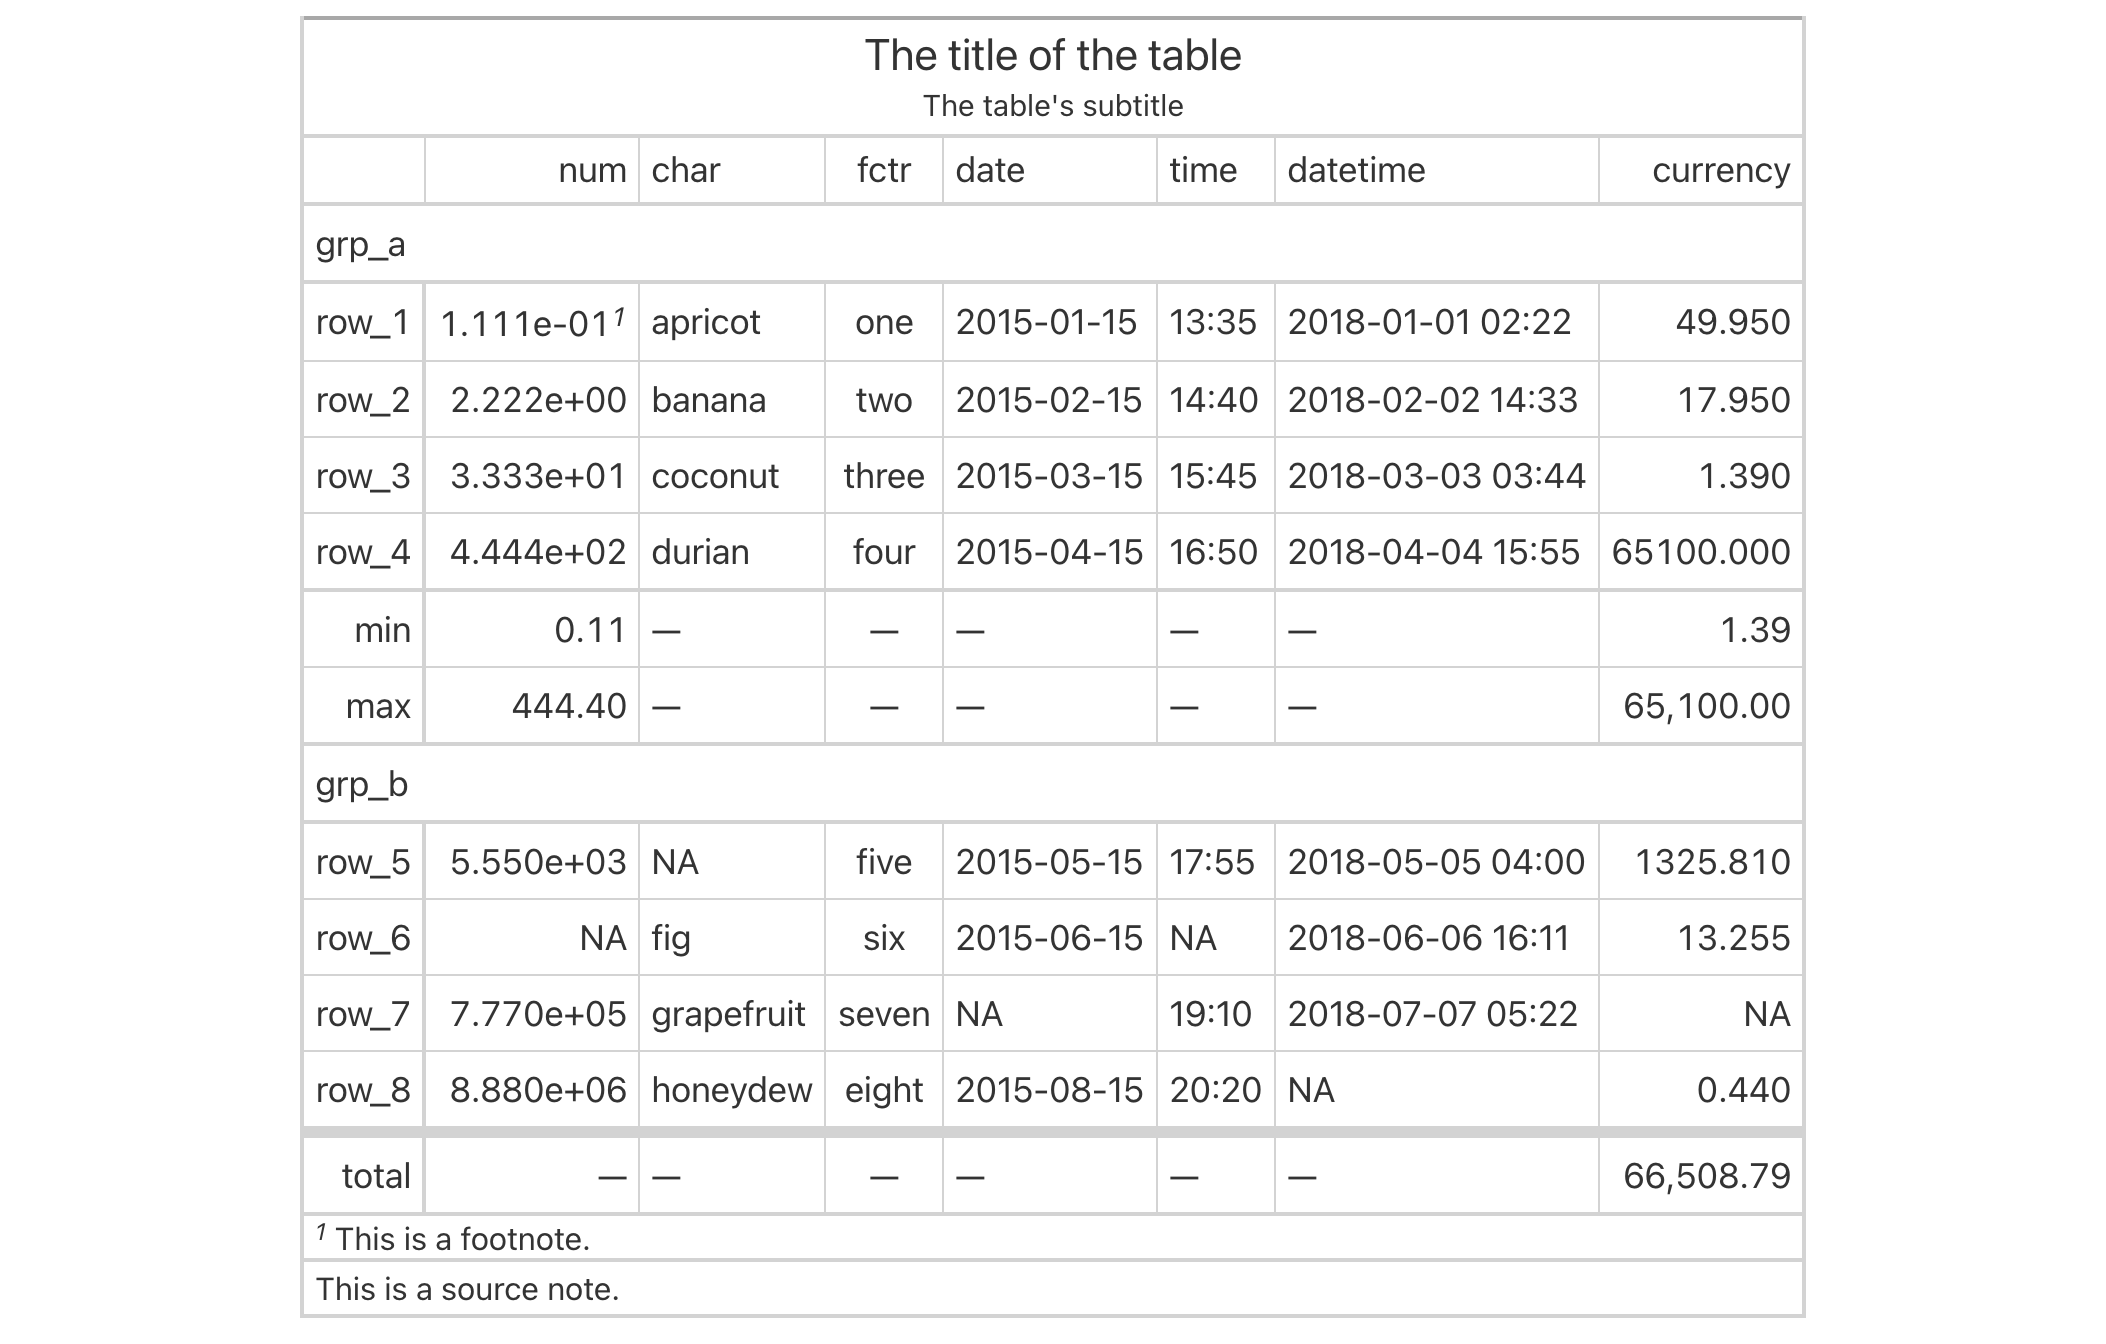
Use the exibble dataset to create a gt table with a number of table
parts added (using functions like summary_rows(), grand_summary_rows(),
and more). Following that, we'll use the opt_table_lines() function to
generate lines everywhere there can possibly be lines (the default for the
extent argument is "all").
exibble |>
  gt(rowname_col = "row", groupname_col = "group") |>
  summary_rows(
    groups = "grp_a",
    columns = c(num, currency),
    fns = c("min", "max")
  ) |>
  grand_summary_rows(
    columns = currency,
    fns = total ~ sum(., na.rm = TRUE)
  ) |>
  tab_source_note(source_note = "This is a source note.") |>
  tab_footnote(
    footnote = "This is a footnote.",
    locations = cells_body(columns = 1, rows = 1)
  ) |>
  tab_header(
    title = "The title of the table",
    subtitle = "The table's subtitle"
  ) |>
  opt_table_lines()