When using cut() (or other functions that use it in some way)
you get bins that can look like this: "(0,10]", "(10,15]", "(15,20]",
"(20,40]". This interval notation expresses the lower and upper limits of
each range. The square or round brackets define whether each of the endpoints
are included in the range ([/] for inclusion, (/) for exclusion).
Should bins of this sort be present in a table, the fmt_bins() function can
be used to format that syntax to a form that presents better in a display
table. It's possible to format the values of the intervals with the fmt
argument, and, the separator can be modified with the sep argument.
Usage
fmt_bins(
  data,
  columns = everything(),
  rows = everything(),
  sep = "--",
  fmt = NULL
)
Arguments
- data
The gt table data object
obj:<gt_tbl>// requiredThis is the gt table object that is commonly created through use of the
gt()function.- columns
Columns to target
<column-targeting expression>// default:everything()Can either be a series of column names provided in
c(), a vector of column indices, or a select helper function (e.g.starts_with(),ends_with(),contains(),matches(),num_range()andeverything()).- rows
Rows to target
<row-targeting expression>// default:everything()In conjunction with
columns, we can specify which of their rows should undergo formatting. The defaulteverything()results in all rows incolumnsbeing formatted. Alternatively, we can supply a vector of row captions withinc(), a vector of row indices, or a select helper function (e.g.starts_with(),ends_with(),contains(),matches(),num_range(), andeverything()). We can also use expressions to filter down to the rows we need (e.g.,[colname_1] > 100 & [colname_2] < 50).- sep
Separator between values
scalar<character>// default:"--"The separator text that indicates the values are ranged. The default value of
"--"indicates that an en dash will be used for the range separator. Using"---"will be taken to mean that an em dash should be used. Should you want these special symbols to be taken literally, they can be supplied withinbase::I().- fmt
Formatting expressions
<single expression>// default:NULL(optional)An optional formatting expression in formula form. If used, the RHS of
~should contain a formatting call (e.g.,~ fmt_number(., decimals = 3, use_seps = FALSE).
Compatibility of formatting function with data values
fmt_bins() is compatible with body cells that are of the "character" or
"factor" types. Any other types of body cells are ignored during formatting.
This is to say that cells of incompatible data types may be targeted, but
there will be no attempt to format them.
Formatting expressions for fmt
We can supply a one-sided (RHS only) expression to fmt, and, several can be
provided in a list. The expression uses a formatting function (e.g.,
fmt_number(), fmt_currency(), etc.) and it must contain an initial .
that stands for the data object. If performing numeric formatting it might
look something like this:
fmt = ~ fmt_number(., decimals = 1, use_seps = FALSE)
Examples
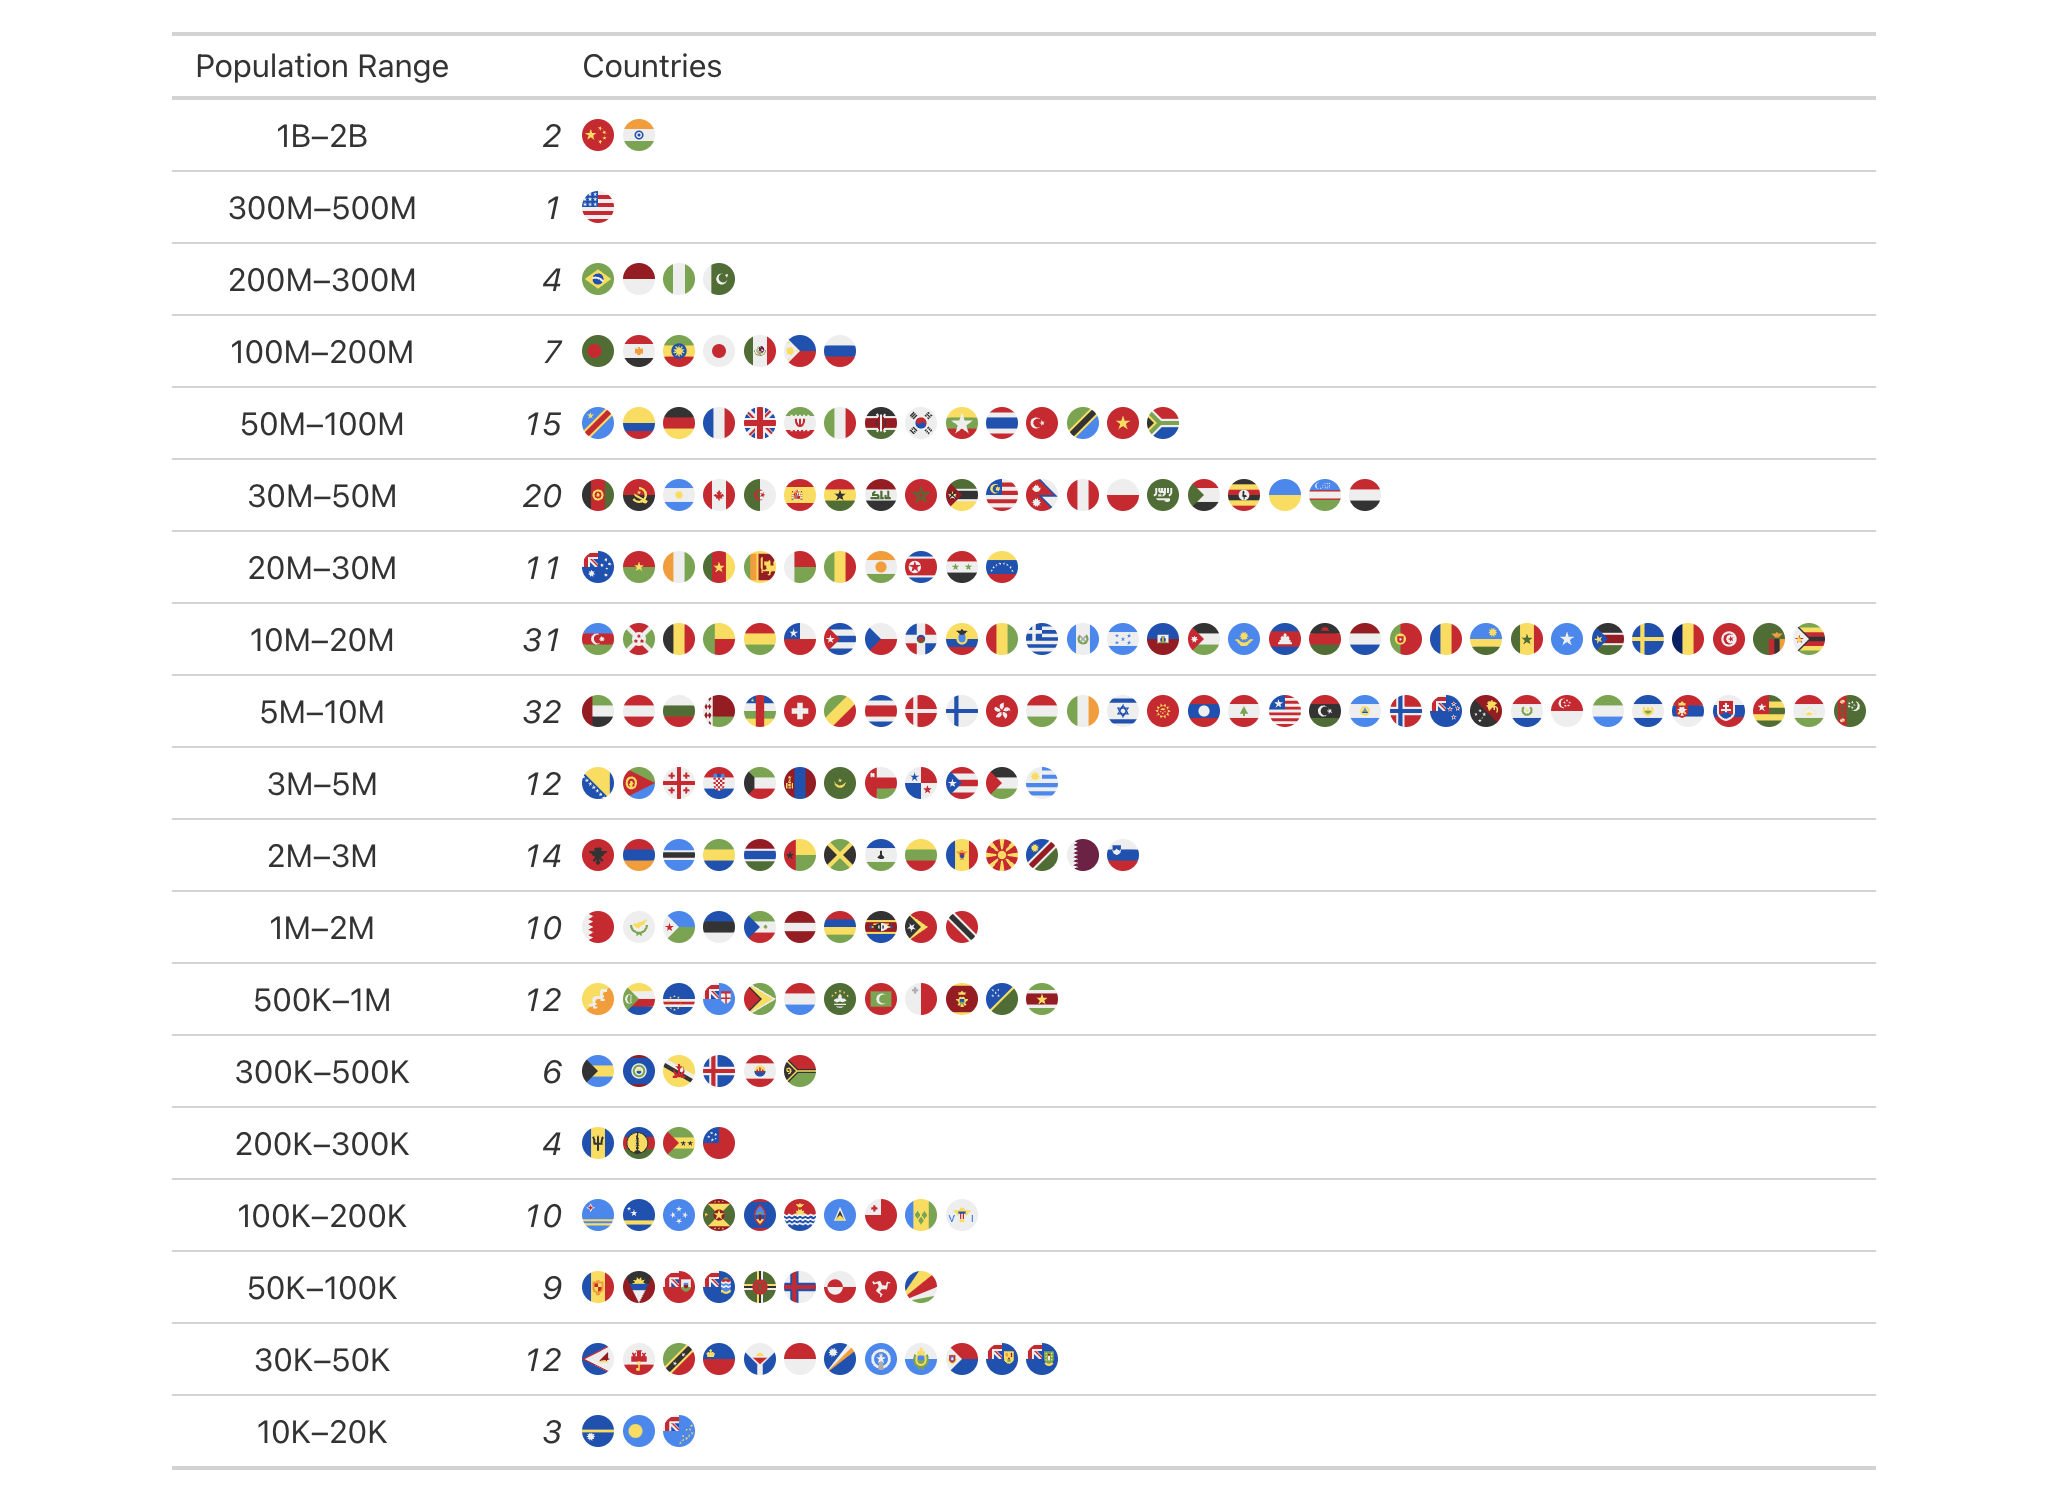
Use the countrypops dataset to create a gt table. Before even getting
to the gt() call, we use cut() in conjunction with scales::breaks_log()
to create some highly customized bins. Consequently each country's population
in the 2021 year is assigned to a bin. These bins have a characteristic type
of formatting that can be used as input to fmt_bins(), and using that
formatting function allows us to customize the presentation of those ranges.
For instance, here we are formatting the left and right values of the ranges
with fmt_integer() (using formula syntax).
countrypops |>
  dplyr::filter(year == 2021) |>
  dplyr::select(country_code_2, population) |>
  dplyr::mutate(population_class = cut(
    population,
    breaks = scales::breaks_log(n = 20)(population)
    )
  ) |>
  dplyr::group_by(population_class) |>
  dplyr::summarize(
    count = dplyr::n(),
    countries = paste0(country_code_2, collapse = ",")
  ) |>
  dplyr::arrange(desc(population_class)) |>
  gt() |>
  fmt_flag(columns = countries) |>
  fmt_bins(
    columns = population_class,
    fmt = ~ fmt_integer(., suffixing = TRUE)
  ) |>
  cols_label(
    population_class = "Population Range",
    count = "",
    countries = "Countries"
  ) |>
  cols_width(
    population_class ~ px(150),
    count ~ px(50)
  ) |>
  tab_style(
    style = cell_text(style = "italic"),
    locations = cells_body(columns = count)
  )
See also
Other data formatting functions:
data_color(),
fmt(),
fmt_auto(),
fmt_bytes(),
fmt_chem(),
fmt_country(),
fmt_currency(),
fmt_date(),
fmt_datetime(),
fmt_duration(),
fmt_email(),
fmt_engineering(),
fmt_flag(),
fmt_fraction(),
fmt_icon(),
fmt_image(),
fmt_index(),
fmt_integer(),
fmt_markdown(),
fmt_number(),
fmt_number_si(),
fmt_partsper(),
fmt_passthrough(),
fmt_percent(),
fmt_roman(),
fmt_scientific(),
fmt_spelled_num(),
fmt_tf(),
fmt_time(),
fmt_units(),
fmt_url(),
sub_large_vals(),
sub_missing(),
sub_small_vals(),
sub_values(),
sub_zero()